Gallery.
MP2 Writeup.
Overview and Usage
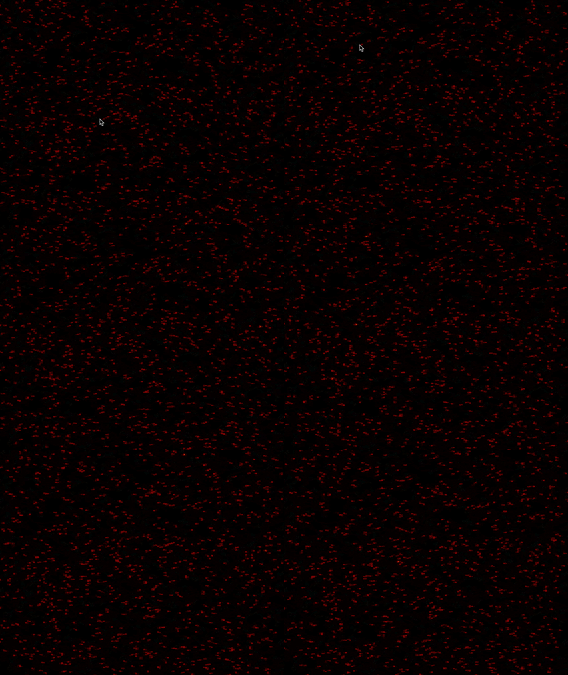
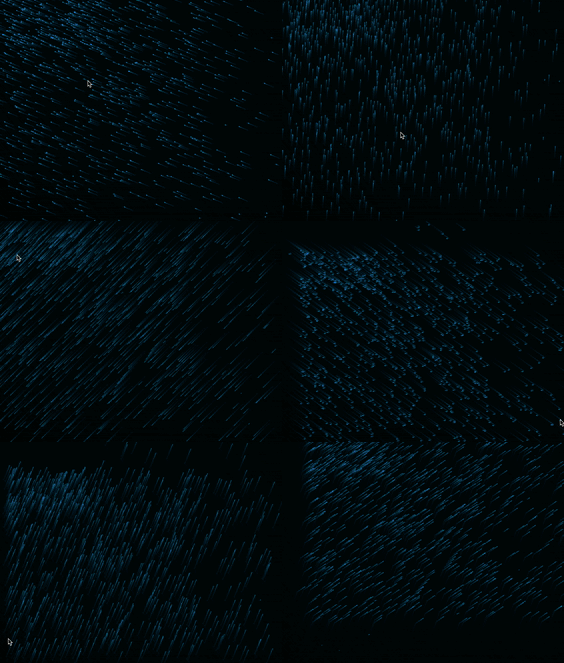
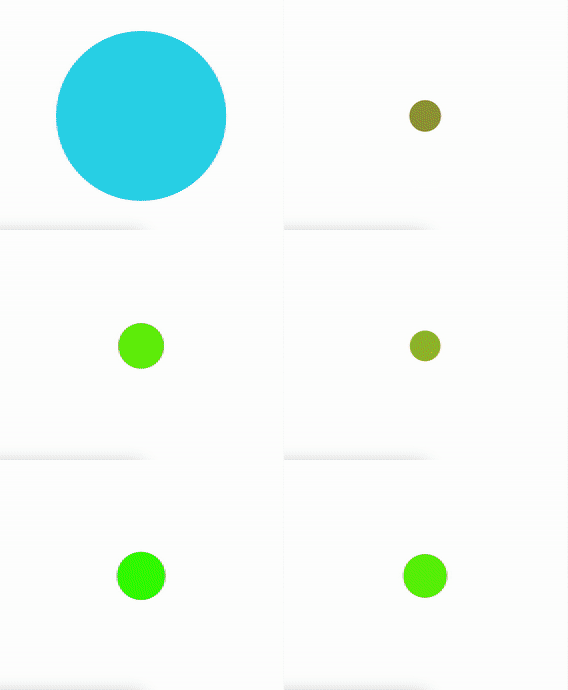
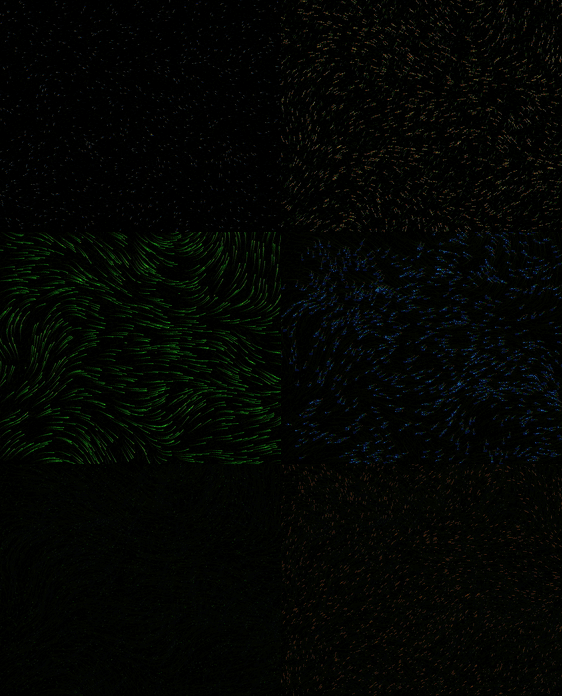
In this mini project, I created visualizations on p5.js that are displayed in the gallery above. To do so, it required knowledge of JavaScript and the p5 library, which is very intuitive. I had already used p5 in a previous class (CSE 412), so this project wasn't too difficult. I went from simpler to more complex code as time went on, which by the end I created a dynamic visualization that depends on the device's microphone volume. To view and use my code in real time, you can visit my collection here and click on any of the projects. From there, if you press the play button, you can see what happens as the code runs.
Development Process
Relearning p5.js
Because I had already worked with p5.js, this mini project wasn't very difficult for me. However, I had taken the class in the spring of 2022, so some concepts were a bit fuzzy to me. After looking through my previous code and reading on some documentation, I finally got back in to the hang of the syntax and how to achieve the things I wanted.
Completing Each Visualization
Each visualization got progessively more complex as I incorporated more features to the visualization such as making them dynamic, random, or use device microphone volume. Though, each visualization I had a general idea of what I wanted, so as I wrote my code and saw how it changed the graphics I chose to keep what I thought look the most interesting or closest to my intial idea.
Issue Deep-Dive
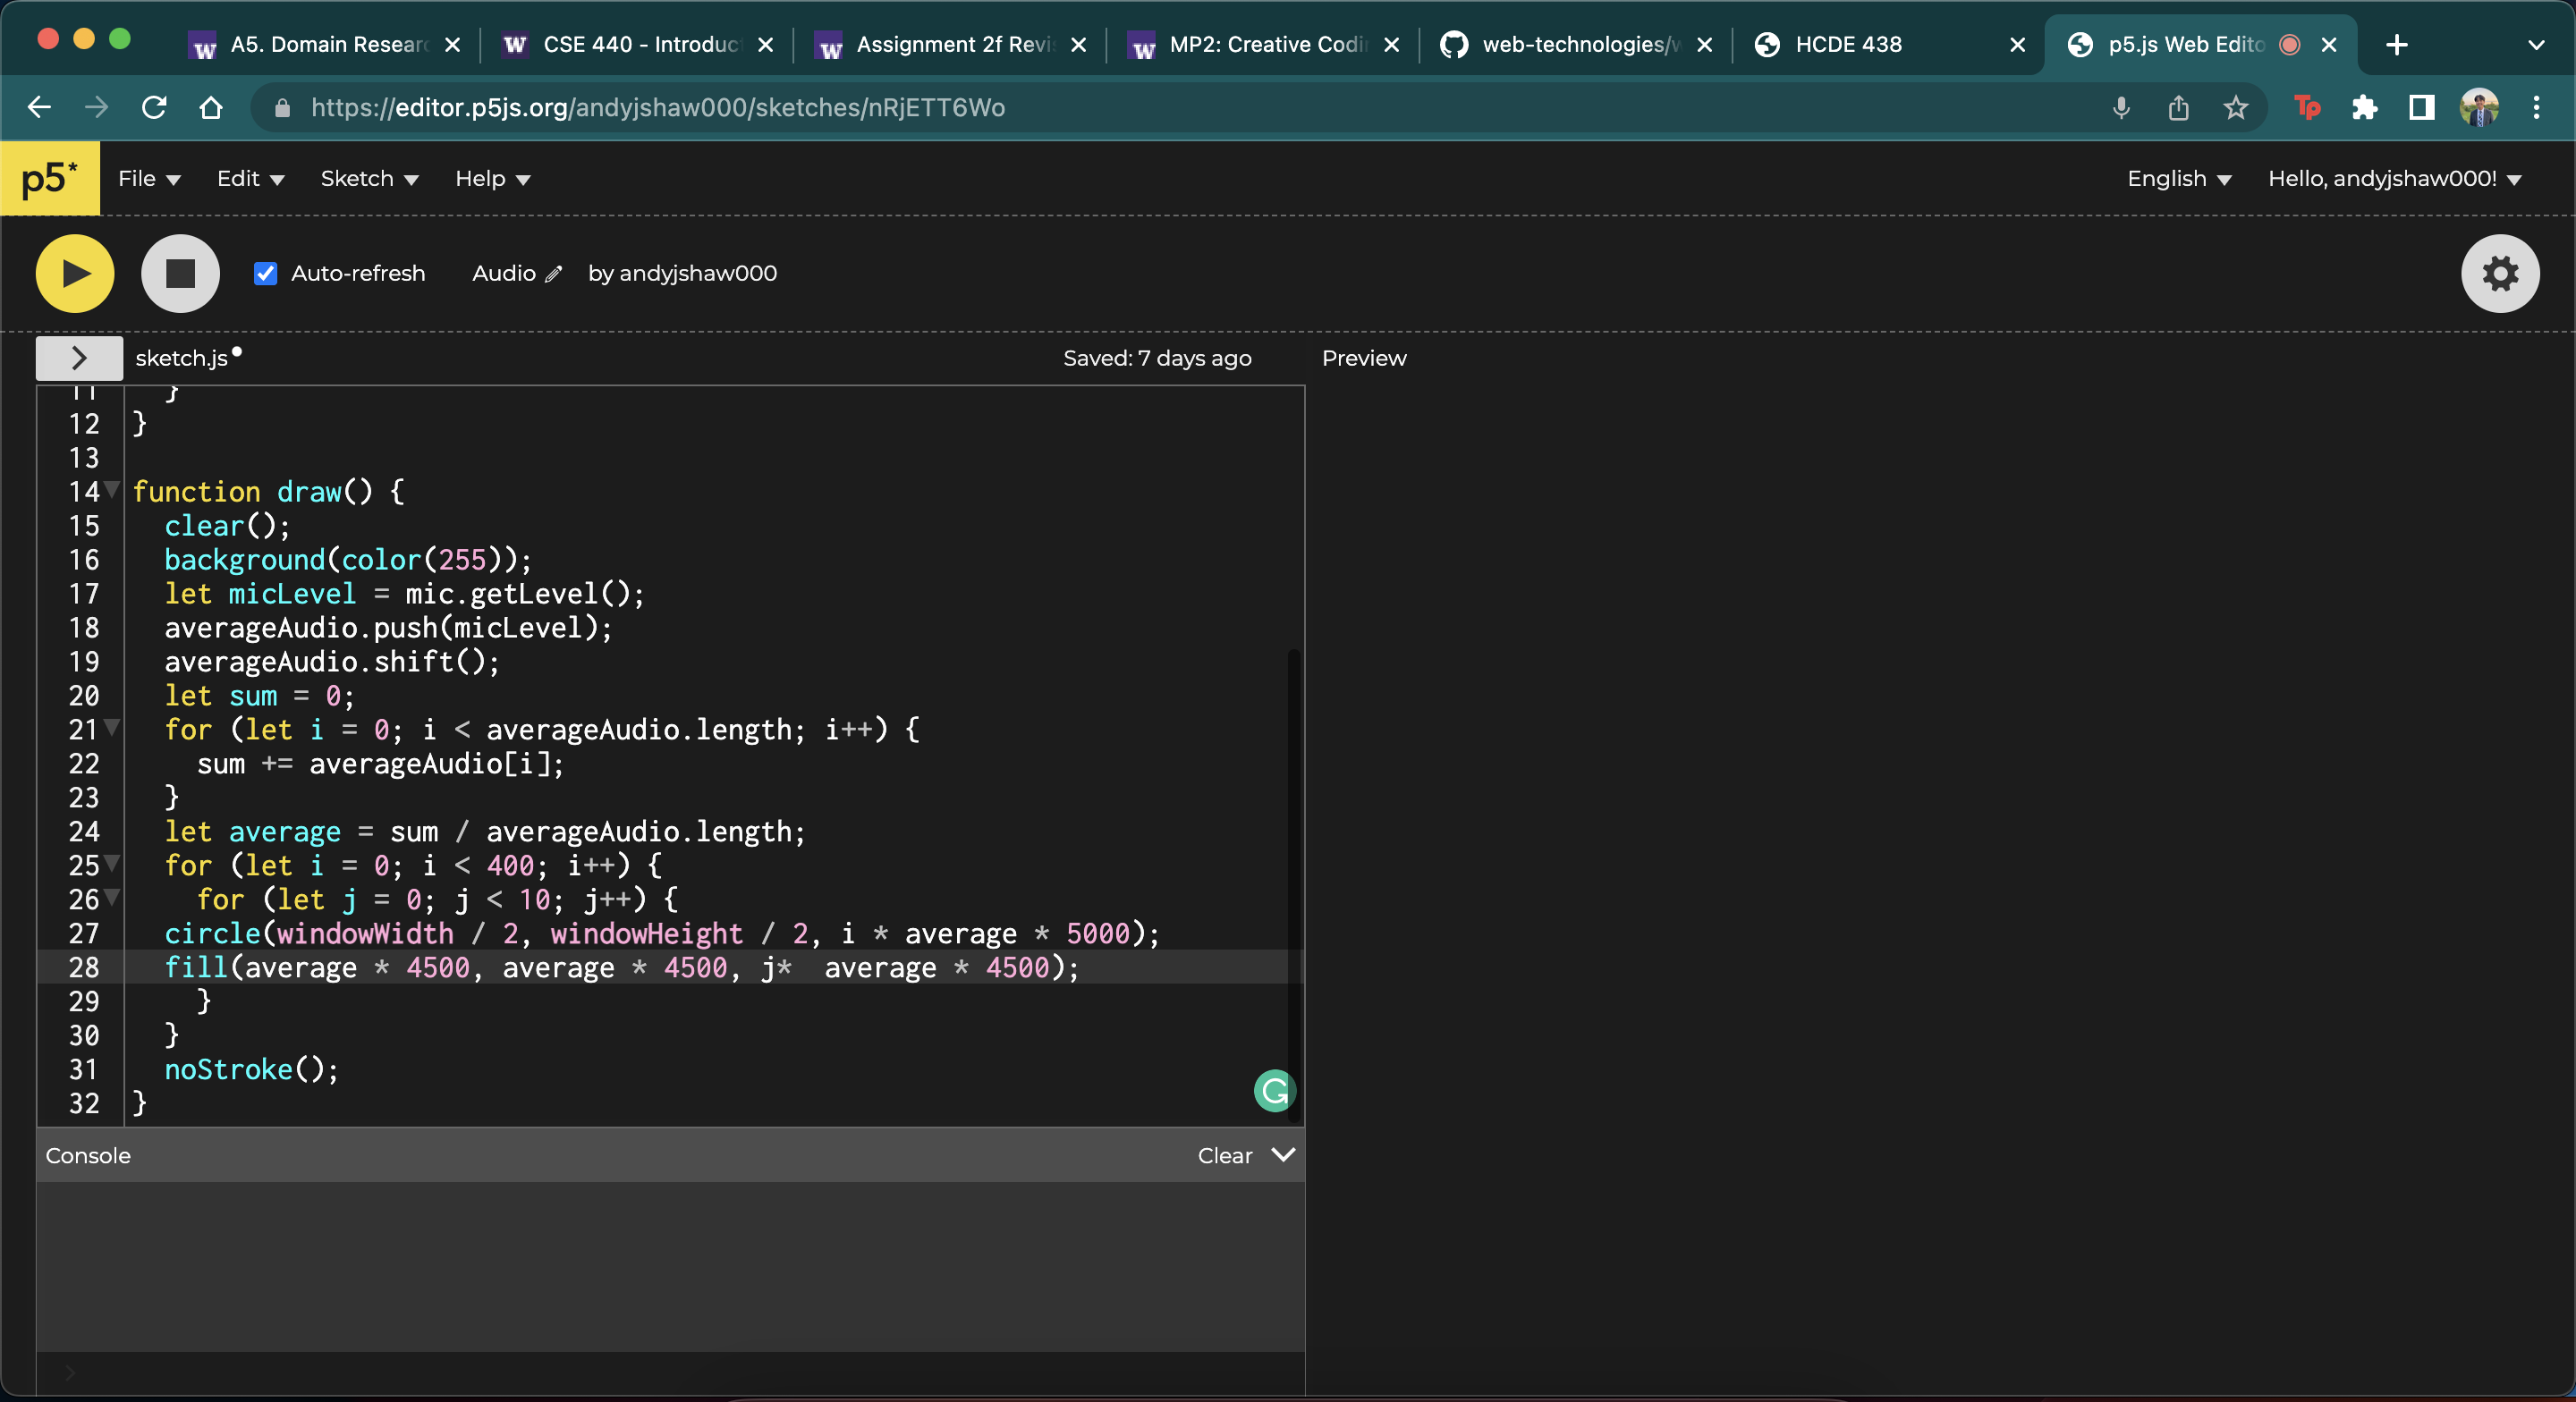
An issue I ran into was trying to think differently with the draw() function. I've spent most of my time with code that runs once and not indefinitely. My only experience with code that runs forever is with RobotC and Arduino, though those were very short periods, so it was difficult again to try and wrap my head around the draw() function that is called every frame. I spent a lot of time trying to figure out why code would run indefinitely or act weird (and it was mostly due to having large for loops in draw()). How I got over this was spending more time with the code and getting used to how it worked. At the end of the interactive visualization, I finally got a hang of it.
Ideas and Future
- Recreating a visualizer similar to those in Youtube videos for dubstep/EDM
- Trying out more interactivity instead of microphone volume and mouse input
- Making a game out of mouse and keyboard input
